Troubleshoot with Casewhere logs
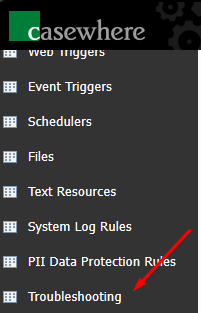
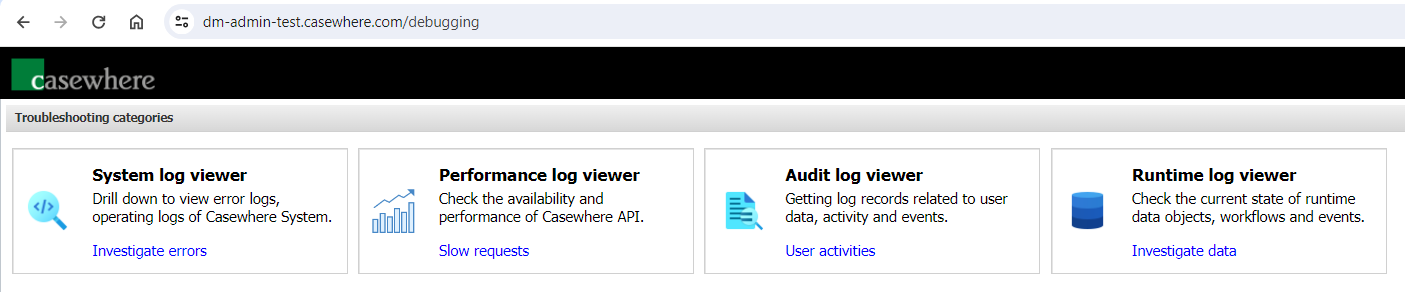
Casewhere logs are one of the most crucial tools you need to get familiar with to troubleshoot problems in production. The Casewhere Troubleshoot Tools can be found at /debugging or via the Troubleshooting menu in Casewhere Admin. The menu is only available for users with the Administrator role.
System log viewer
By default, Casewhere stores logs in MongoDB. From Casewhere Admin, you can access the log data using Log Viewer at the path "/logviewer". For example, https://admin-dev.casewhere.com/logviewer.
In this page, you can drill down to view error logs, operating logs of Casewhere System.
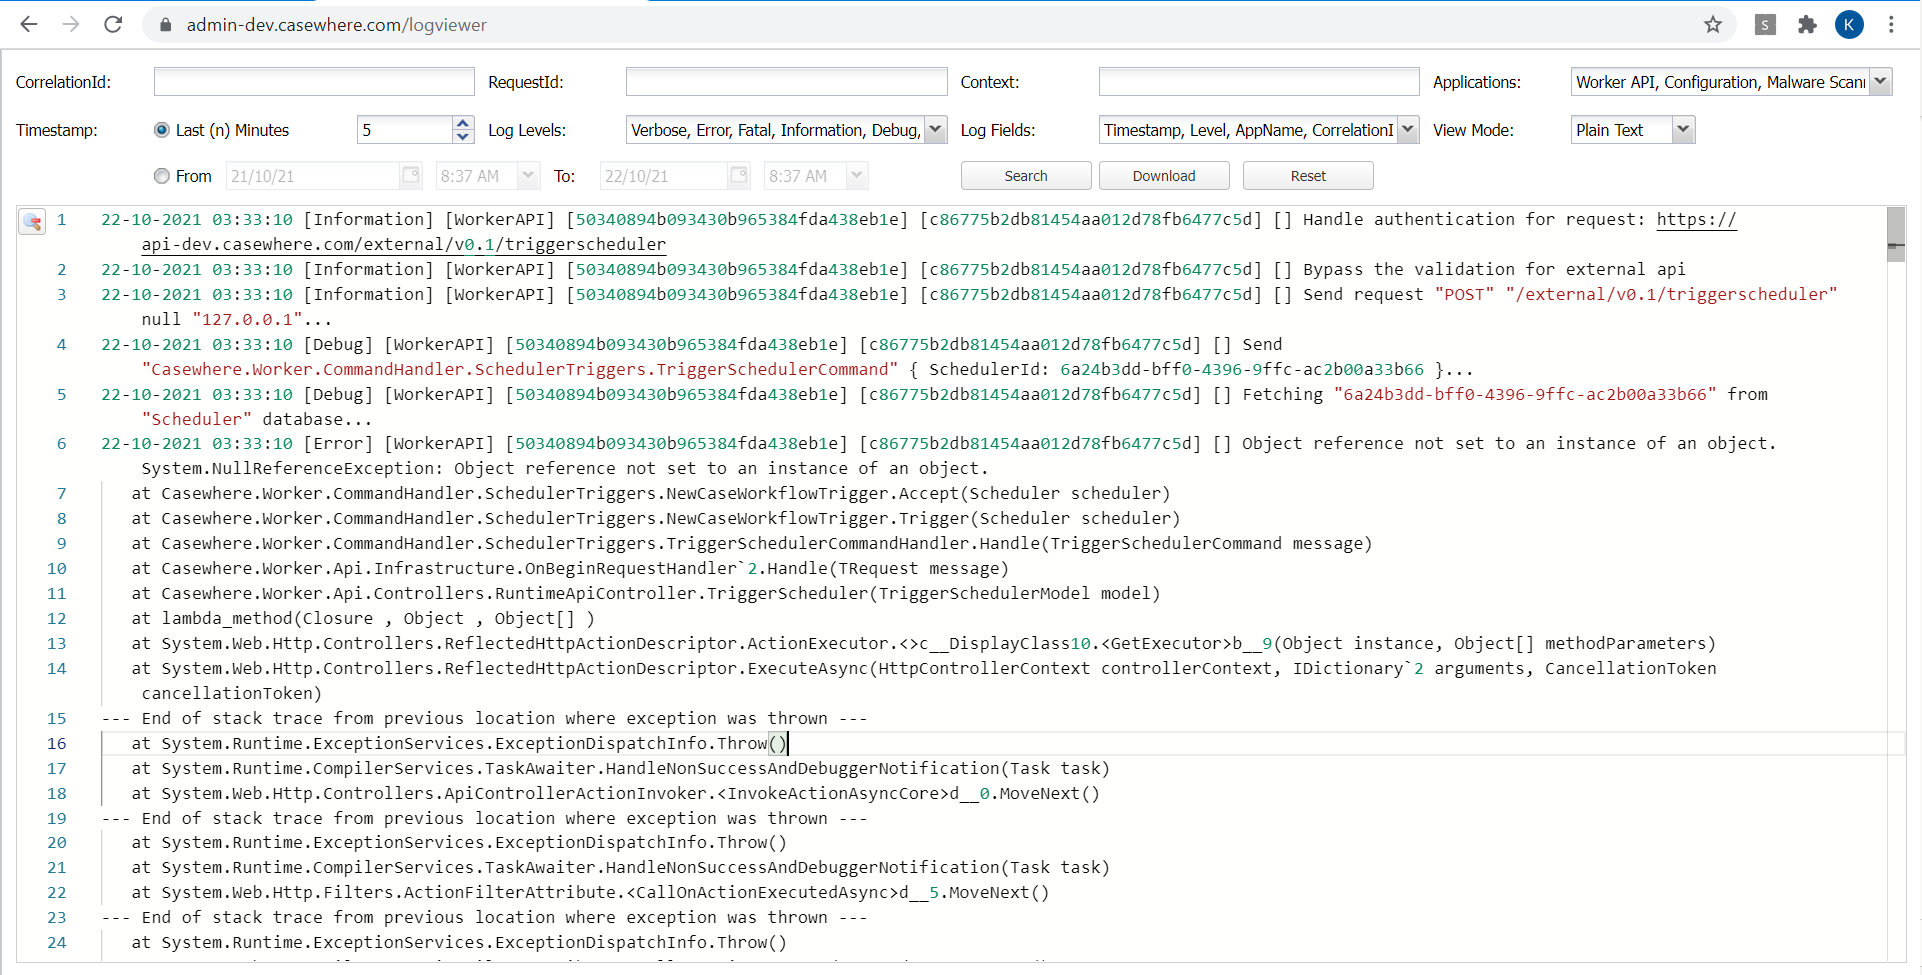
It's possible to filter log data using the below fields:
| Field name | Description |
|---|---|
CorrelationId |
All HTTP requests in the same context will share a CorrelationId. For example, workflow A creates data object B, that triggers a workflow C through a data trigger. Workflow A and workflow C will share the same CorrelationId. Casewhere automatically set the CorrelationId, which can be found in the HTTP response header. |
RequestId |
Casewhere will assign each HTTP request a unique ID, which can be found in the HTTP response header. From v2.7.0, you can query log data by RequestId. |
Context |
The logging context in which Casewhere writes log. One typical use case for the Context is to view log for a specific workflow. You can use this syntax Workflow:<workflow_guid_id> to filter log data. For example, Workflow:6a24b3dd-bff0-4396-9ffc-ac2b00a33b66. |
Applications |
The sources generate log data. |
Timestamp |
The time log data is created. |
Log Levels |
Casewhere write logs at different levels and each level has its own purposes. You can read more here. |
Log Fields |
You can use this setting to choose which fields you want to see in the Log Viewer. This setting is available from v2.7.0 and it's applicable for the Plain Text view mode only. |
View Mode |
Plain Text or Json. |
Logging levels
Below are the logging levels Casewhere is writing logs with. It's possible to configure the minimum level specifically for a Casewhere deployment.
| Level | Usage |
|---|---|
Verbose |
Verbose is the noisiest level, rarely (if ever) enabled for a production app. |
Debug |
Debug is used for internal system events that are not necessarily observable from the outside, but useful when determining how something happened. |
Information |
Information events describe things happening in the system that correspond to its responsibilities and functions. Generally these are the observable actions the system can perform. |
Warning |
When service is degraded, endangered, or may be behaving outside of its expected parameters, Warning level events are used. |
Error |
When functionality is unavailable or expectations broken, an Error event is used. |
Fatal |
The most critical level, Fatal events demand immediate attention. This level is available from v2.7.0. |
Tips
Performance log viewer
Casewhere tracks the response time of all HTTP requests and stores the data in MongoDB by default. If you can access the log database, you will find the data in the PerfLogs collection.
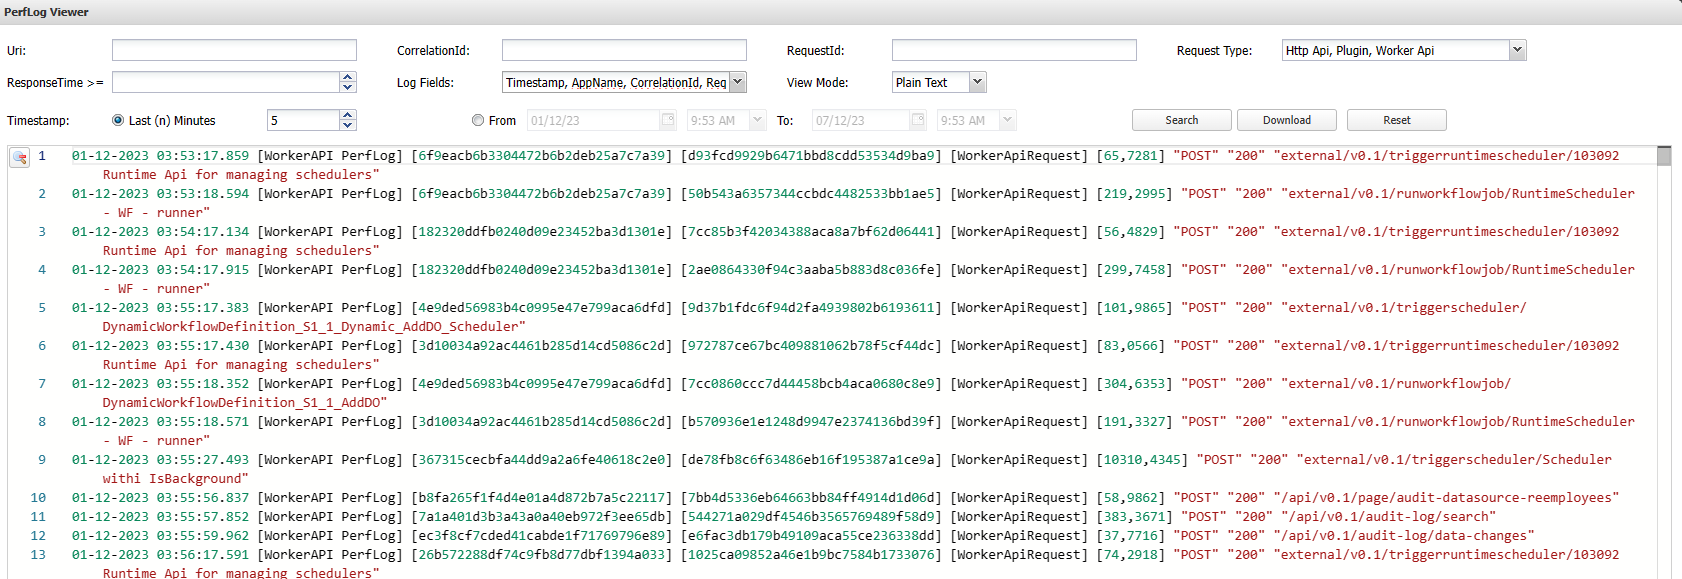
In this page, you can check the availability and performance of Casewhere API. The filtering of performance logs same as System log viewer.
Below are the properties of a performance-log entry:
| Name | Description |
|---|---|
Timestamp |
The time log data is created. Use this field if you want to query data by time. |
Properties.RequestUri |
The full URI of the HTTP request. |
Properties.Uri |
The URI of the HTTP request without the query string. |
Properties.ResponseTime |
Response time in milliseconds. |
Properties.HttpMethod |
The HTTP method. For example, POST, GET, PUT, DELETE. |
Properties.StatusCode |
The HTTP response status code. For example, 200 means success. |
Properties.CorrelationId |
The unique Id you can use to trace data in the system log. All related HTTP requests will share the same CorrelationId. |
Properties.RequestId |
The unique Id you can use to trace data in the system log. Each HTTP request has an Id assigned by Casewhere. |
Properties.Type |
Type of the request. Possible values are: WorkerApiRequest, PluginRequest, HttpApiRequest. The last two represent external calls. |
Properties.AppName |
The sources generate log data. |
Here is an example of performance-log data:
{
    "_id" : ObjectId("615a7aaef9d398600cc8bd79"),
    "Timestamp" : ISODate("2021-10-04T03:53:17.597Z"),
    "Level" : "Information",
    "MessageTemplate" : "api/v0.1/worker-site/worker-site-components/worker-local.casewhere.com",
    "RenderedMessage" : "api/v0.1/worker-site/worker-site-components/worker-local.casewhere.com",
    "Properties" : {
        "RequestUri" : "/api/v0.1/worker-site/worker-site-components?workerSiteId=989d20c0-c0ff-4a4b-ad8f-ad81010c4292",
        "ResponseTime" : 7.3167,
        "HttpMethod" : "GET",
        "StatusCode" : "200",
        "Uri" : "api/v0.1/worker-site/worker-site-components/worker-local.casewhere.com",
        "Type" : "WorkerApiRequest",
        "CorrelationId" : "58be16a31f0347e5936d6054e83f4502",
        "RequestId" : "f82caaaea4114c9eb4e5ad9a58f0bcb7",
        "RequestTimestamp" : "2021-10-04T03:53:17.5908466Z",
        "AppName" : "WorkerAPI PerfLog"
    },
    "UtcTimestamp" : "2021-10-04 03:53:17Z"
}
Tips
Audit log viewer
Audit logs are a valuable resource for admins and auditors who want to examine suspicious activity or diagnose and troubleshoot issues. It's possible to configure Casewhere to track data changes and important events that happened in the system and store them in a more consistent, readable format.
Currently, Casewhere audits the following events:
- Data change events: All changes are logged. It's possible to specify what to log and what to ignore at the field level
- Read events: It’s possible to enable logging for read access to critical data sources
- Authentication: All events related to authentication are logged by default
- Custom logging: It’s possible to hook into any workflow/process for custom logging
Using the tool, you can get log records related to user data, activity, and events
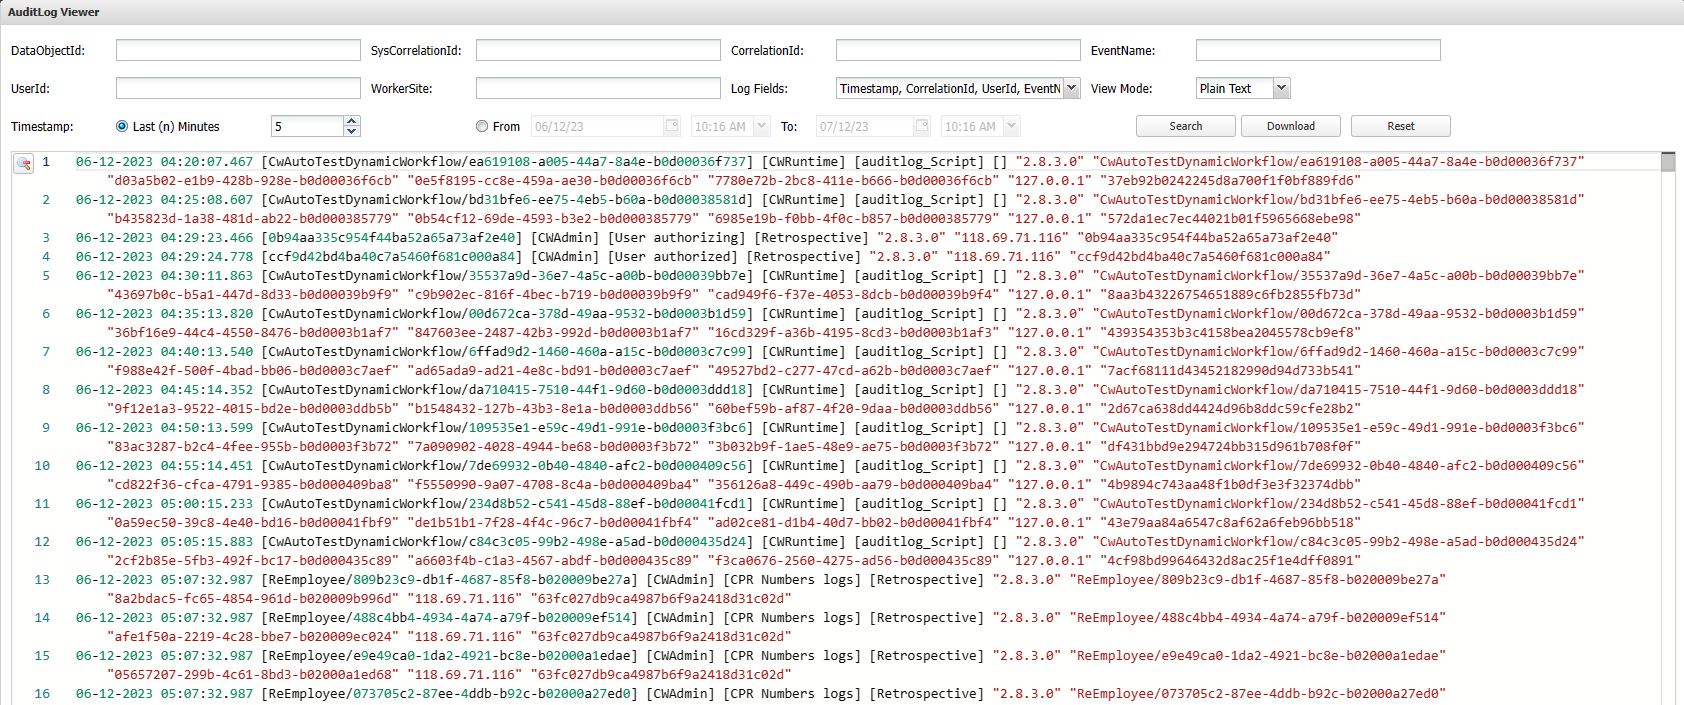
Below are the properties of an audit-log entry:
| Field name | Description |
|---|---|
EventName |
The event being logged. For example, auditlog_Send, User authorized |
UserId |
Id of the user |
UserClaims |
Username, roles, and other claims. It's possible to select which claims to log |
WorkerSite |
The site in which the event happened |
CorrelationId |
It's possible to use a business value, e.g., CustomerID, to track all related events |
SysCorrelationId |
All HTTP requests in the same business context will share a SysCorrelationId generated by the system |
Timestamp |
The time the event happened |
IsCustomLog |
The event is built-in or custom |
PlatformVersion |
The version of the Casewhere platform |
IpAddress |
The client's IP address |
BrowserAgent |
The browser sending the request |
Data |
For data change events, the system will track changed information in the following format [{AttributeName: "Status", FromValue: "Submitted", ToValue: "Approved"}] |
DataObjectId |
The data object being changed, which emits the event |
DataSourceId |
The data source being read, which emits the query event |
ActivityId |
The activity that emits the event |
WorkflowId |
The workflow that emits the event |
CaseId |
The case that emits the event |
Below is an example of an audit log record:
{
    "_id" : NUUID("f0458910-ec3b-4e68-a271-d348668aad6a"),
    "_t" : [
        "AuditLog",
        "DataObjectAuditLog"
    ],
    "EventName" : "auditlog_Auto approve",
    "UserId" : "pnk",
    "WorkerSite" : "Caseworker Site",
    "UserClaims" : [
        {
            "Key" : "Username",
            "Values" : [
                "pnk",
                "GLOBETEAM\\pnk"
            ]
        },
        {
            "Key" : "Roles",
            "Values" : [
                "Employee",
                "Administrator"
            ]
        }
    ],
    "CorrelationId" : null,
    "SysCorrelationId" : "cc645a2cba0f45eeb8df32a6a98085f1",
    "Timestamp" : ISODate("2022-08-25T07:41:38.249Z"),
    "IsCustomLog" : false,
    "PlatformVersion" : "2.8.0.0",
    "DataObjectId" : "CwUatTx2Application/ab77d7ee-6e33-4984-879b-aefc007ecada",
    "ActivityId" : NUUID("2e97482e-82f8-401c-bd62-aefc007ecadc"),
    "WorkflowId" : NUUID("d43210ff-71d6-4101-9292-aefc007ecadb"),
    "CaseId" : NUUID("c6ab7fd3-8adc-4f42-8539-ae91006484ad"),
    "Data" : [
        {
            "AttributeName" : "Status",
            "FromValue" : "Submitted",
            "ToValue" : "Approved"
        }
    ],
    "IpAddress" : "127.0.0.1",
    "BrowserAgent" : "Mozilla/5.0 (Windows NT 10.0; Win64; x64) AppleWebKit/537.36 (KHTML, like Gecko) Chrome/104.0.0.0 Safari/537.36"
}
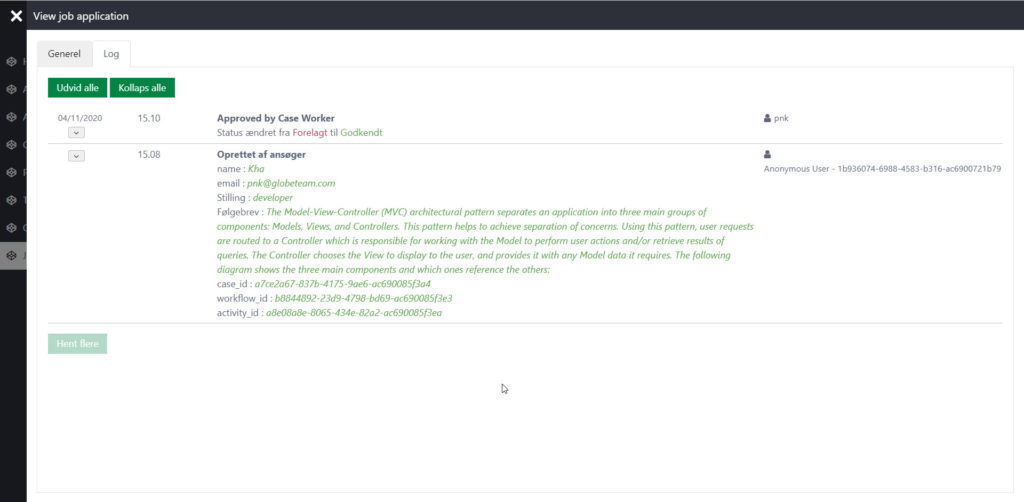
Casewhere also provides an audit-log viewer that developers can embed in worker sites.
Runtime log viewer
You can use this tool to examine the state of a workflow, a data object, or Casewhere events. This is useful in many cases
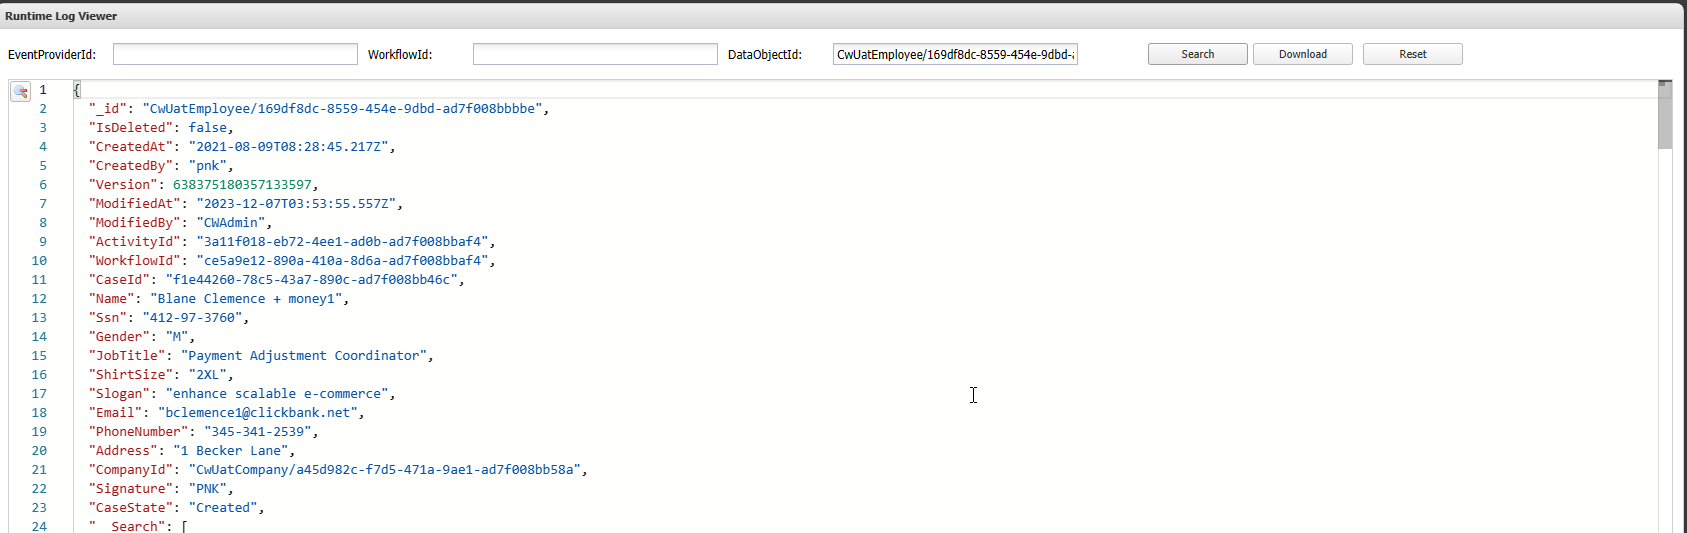
- EventProviderId: The data object ID.
- WorkflowId: The workflow ID.
- DataObjectId: The data object ID.
Note: Sensitive information will be masked following the rules defined in the System log rules.