Custom widget
While the grid widget and list widget cover the most common scenarios, there will be cases where business requirements call for a fully customized UI.
The Custom Widget feature in Casewhere makes this possible. Custom widgets are built with HTML, CSS, and JavaScript. Like built-in widgets, they can load and display data from Casewhere data sources.
Configure custom widget
There are three steps to configure a custom widget:
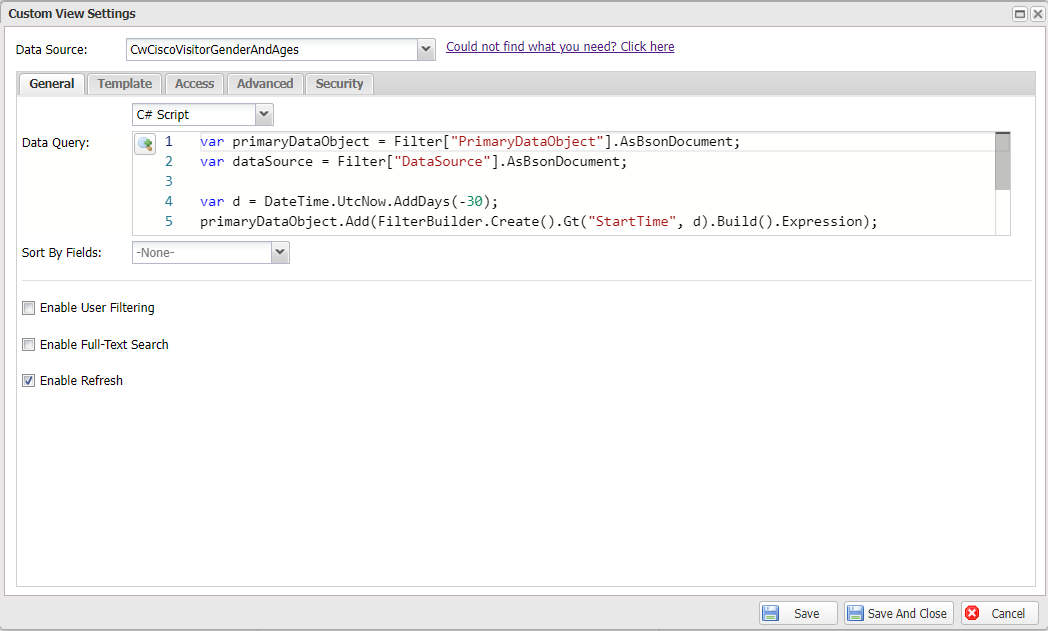
Step 1. Select a data source.
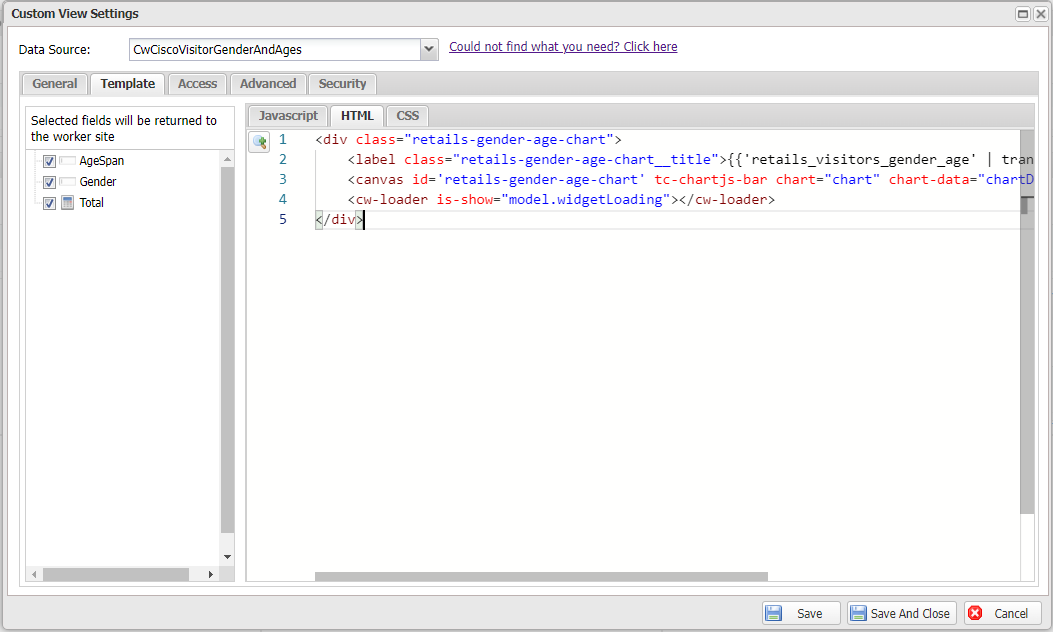
Step 2. Design the widget template. Casewhere generates a default template you can customize when creating a new widget.
Step 3. Configure other settings. A custom widget shares all common settings with other widget types. Read more in Widget management.
Additional settings
- Disable Paging: When enabled, the widget will not paginate data. Use this when you want to load all records at once — for example, when rendering charts or custom visualizations.
Access data source data
When a custom widget has a data source, Casewhere loads the data and exposes it on the widget's model.widgetData object. The records are in model.widgetData.data:
// model.widgetData = { data, total, metadata, ... }
var books = model.widgetData.data;
Call model.refresh() to reload the data — for example, after the user changes a filter or the underlying data is updated. Use Widget data query to control how the data is loaded.
A simple example
Suppose the business team asks developers to build simple charts with provided input values.
This kind of requirement does not fit neatly into a grid or list widget. Fortunately, Casewhere's custom widget lets you integrate any visualization library.
This example uses ChartJS. You can add more libraries to Casewhere through a worker site or theme (navigate to Theme > Custom component > Javascript).
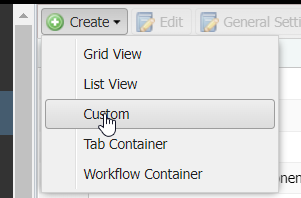
Step 1. Navigate to Widgets, click the Create button, and select Custom.
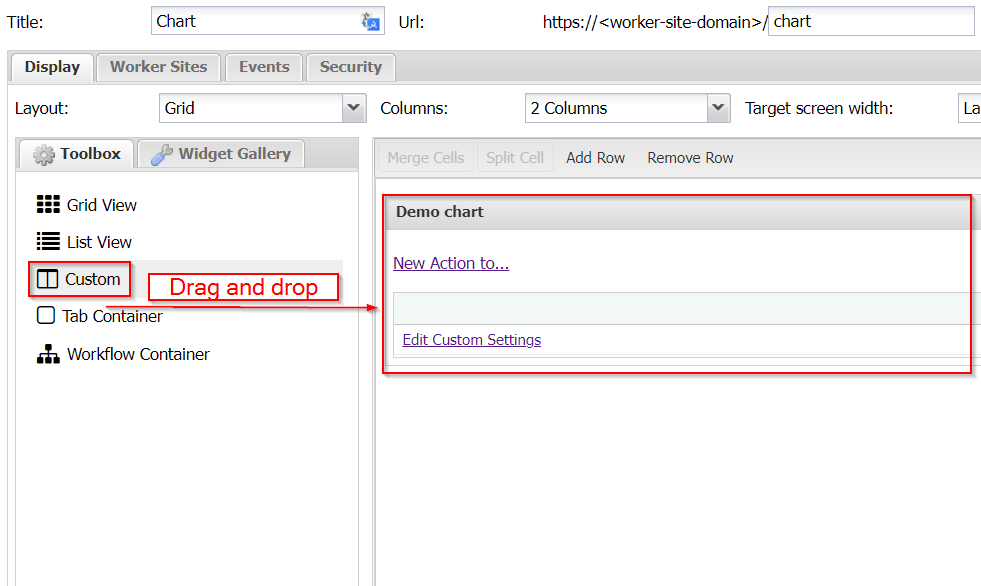
Then drag and drop Custom from Toolbox to main working area.
Step 2. Open the Edit Custom Settings dialog.
Go to the Template tab and append the following code to the end of the default template.
model.options = {
type: 'line',
data1: {
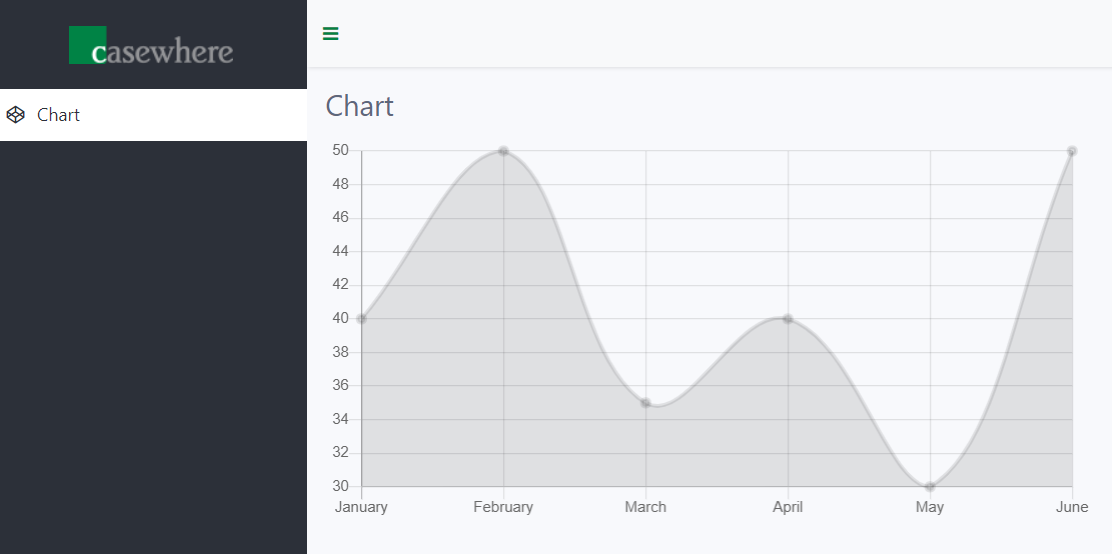
labels: ["January", "February", "March", "April", "May", "June"],
datasets: [
{
label: '# of Votes',
data: [40, 50, 35, 40, 30, 50],
borderWidth: 3
},
]
},
options: {
scales: {
yAxes: [{
ticks: {
reverse: false
}
}]
}
}
};
Go to the HTML tab and paste the following code.
<div class="row d-flex flex-grow">
    <div class="col-12 flex-grow flex-column text-right">
        <canvas id='cisco-chart' tc-chartjs-line chart-data="model.options.data1" chart-options="model.options.options"></canvas>
    </div>
</div>
And that's it. Reload your page to see the chart result.
APIs to use with custom widget
You can inject all AngularJS built-in services to the customWidgetController. Besides that, Casewhere provides many worker services you can use to develop your widget.