Scripting data source
It's easy to design data sources with the current GUI editor. However, for complex reporting scenarios where you need to calculate aggregate values, scripting is a better choice as it gives you all the flexibilities of the MongoDB Aggregation Framework.
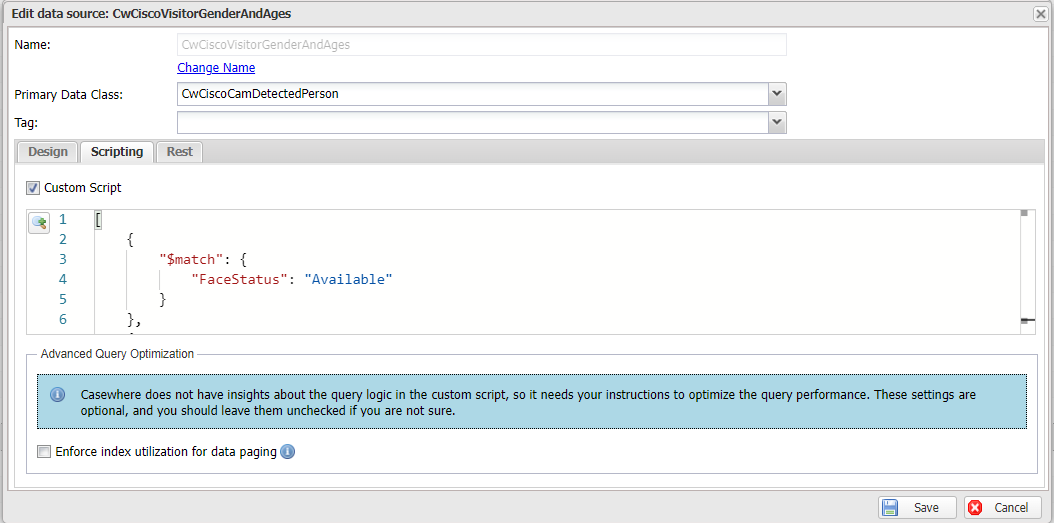
Configure scripting data source
Enable scripting
Navigate to the Scripting tab and enable Custom Script. After that, you can start to compose the script for your data source.
Below are the typical aggregation operations used in most data sources:
You can learn more at Practical MongoDB Aggregations Book.
Data source parameters
A data source can accept parameters, which are accessible via the @params keyword. These parameters can be set from either a Widget Data Query — by populating the dataSourceParameters dictionary — or a Scripted Activity — by calling SetParameters on the data-source query builder.
Define parameters
A typical parameterized data source might look like this:
[
	...
	"BalanceAsOfToDate": {
        "$sum": {
            "$cond": {
                "if": {
                    "$and": [
                        { "$gte": @params.startDate },
                        { "$lte": @params.endDate }
                    ]
                },
                "then": {
                    "$cond": {
                        "if": { "$eq": [ "$TypeOfPosting", "Credit" ] },
                        "then": { "$multiply": [ -1, "$Amount" ] },
                        "else": "$Amount"
                    }
                },
                "else": 0
            }
        }
    }
    ...
]
The snippet above demonstrates:
- How
@paramscan be used within a data source pipeline. - That parameters can be used anywhere in the pipeline—including within nested conditional logic—not just in the
$matchstage. - That a parameter value can be a full BSON expression, not only a scalar. Here
@params.startDateis replaced by the array[ "$PaymentDate", <date> ], so that$gtecompares each document'sPaymentDateagainst the supplied date.
Set parameters
Widget data query: User-defined parameters can be set in the widget using the dataSourceParameters variable. The example below shows a typical implementation.
DateTime startDate = rangeDateFilter["StartDate"];
DateTime endDate = rangeDateFilter["EndDate"];

var startDateBson = new BsonArray();
startDateBson.Add("$PaymentDate");
startDateBson.Add(BsonValue.Create(startDate));

var endDateBson = new BsonArray();
endDateBson.Add("$PaymentDate");
endDateBson.Add(BsonValue.Create(endDate));

dataSourceParameters["startDate"] = startDateBson;
dataSourceParameters["endDate"] = endDateBson;
Scripted activity: Parameters can also be provided using the SetParameters (or SetParameter) method on a data-source query builder — DataSourceEnumerationQuery or DataSourceApiQuery. The example below illustrates a typical implementation.
var startDateParameter = new BsonArray();
startDateParameter.Add("$PaymentDate");
startDateParameter.Add(BsonValue.Create(DateTime.MinValue));

var endDateParameter = new BsonArray();
endDateParameter.Add("$PaymentDate");
endDateParameter.Add(BsonValue.Create(lastDayOfPreviousMonth));

var parameters = new Dictionary<string, object>
{
    { "startDate", startDateParameter },
    { "endDate", endDateParameter }
};

var query = DataSourceEnumerationQuery
    .For("CwAcParkingFeesWithCurrentBalancePerToDateForASpecificPeriodv2")
    .FilterBy(filter)
    .SetParameters(parameters);
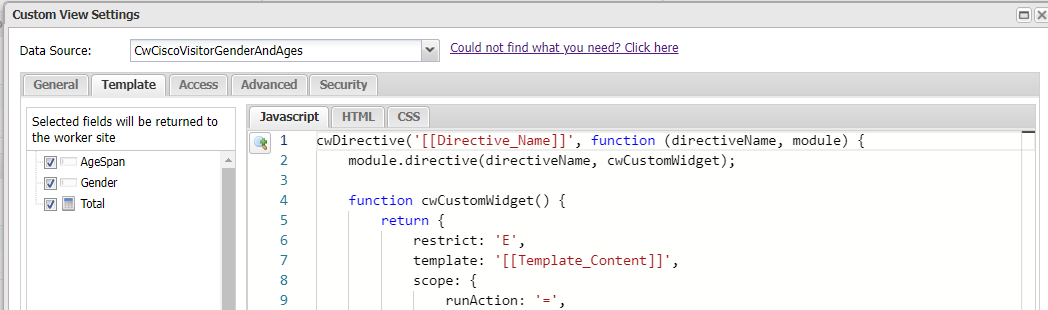
Define the output structure
Casewhere cannot know the output structure for scripting data sources, so it needs you to specify the information. In the tab Design, select Add, and map the fields and nodes to the projection fields in your data source script.

Hint: You should add the fields defined in the projection stage of your data source
[
	...
	{
        "$project": {
            "_id": 0,
            "Gender": "$_id.Gender",
            "AgeSpan": "$_id.AgeSpan",
            "Total": "$Total"
        }
    }
    ...
]
How the pipeline runs
Your script is not executed in isolation. Casewhere splices your aggregation stages into a larger pipeline: it prepends any runtime filter (from a widget or FilterBy) and appends its own filter, sort, paging, and projection stages after your stages. Two consequences are worth noting:
- Unlike a data-class query, a custom-script data source does not automatically exclude soft-deleted documents. If that matters, add your own filter, for example
{ "$match": { "IsDeleted": false } }. - Because Casewhere appends stages after yours, your
$projectis not necessarily the final stage of the executed pipeline.
A simple example
Imagine you're building an intelligent-shopping application that every time a person appears in front of the camera, the application will register a record DetectedPerson (Behavior, Age, Gender) in the database. The customer now asks you to build a report visualizing shop visitors across gender and age like below:
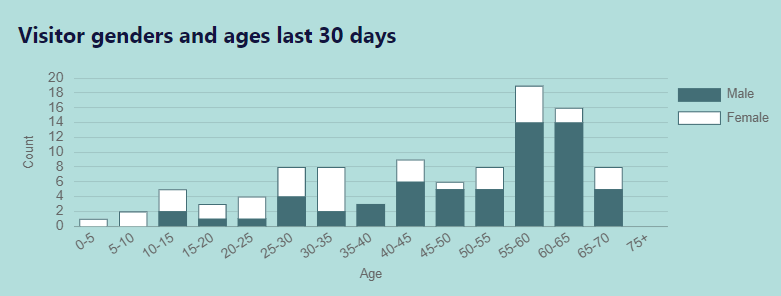
For the report, you will need to make a data source to aggregate the data in DetectedPerson.
[
    {
        "$match": {
            "Behavior": "GoInto"
        }
    },
    {
        "$group": {
            "_id": {
                "Gender": "$Gender",
                "AgeSpan" : {
                    "$switch": {
                        "branches": [
                                { "case": { "$lte": [ "$Age", 5 ] }, "then": "0-5" },
                                { "case": { "$lte": [ "$Age", 10 ] }, "then": "5-10" },
                                { "case": { "$lte": [ "$Age", 15 ] }, "then": "10-15" },
                                { "case": { "$lte": [ "$Age", 20 ] }, "then": "15-20" },
                                { "case": { "$lte": [ "$Age", 25 ] }, "then": "20-25" },
                                { "case": { "$lte": [ "$Age", 30 ] }, "then": "25-30" },
                                { "case": { "$lte": [ "$Age", 35 ] }, "then": "30-35" },
                                { "case": { "$lte": [ "$Age", 40 ] }, "then": "35-40" },
                                { "case": { "$lte": [ "$Age", 45 ] }, "then": "40-45" },
                                { "case": { "$lte": [ "$Age", 50 ] }, "then": "45-50" },
                                { "case": { "$lte": [ "$Age", 55 ] }, "then": "50-55" },
                                { "case": { "$lte": [ "$Age", 60 ] }, "then": "55-60" },
                                { "case": { "$lte": [ "$Age", 65 ] }, "then": "60-65" },
                                { "case": { "$lte": [ "$Age", 70 ] }, "then": "65-70" },
                                { "case": { "$lte": [ "$Age", 75 ] }, "then": "70-75" }
                            ],
                            "default": "75+"
                        }
                    }
                },
                "Total": { "$sum": 1}
            }
        },
    {
        "$project": {
            "_id": 0,
            "Gender": "$_id.Gender",
            "AgeSpan": "$_id.AgeSpan",
            "Total": "$Total"
        }
    },
    {
        "$sort": {
            "AgeSpan": 1
        }
    }
]
After that, define the field mapping in the Design tab.

Finally, create a custom widget using the data source. When you select the data source, the corresponding fields will be loaded and ready to use. How to make the widget is out of the scope of this example.